Orchestrating Multi-Role Reporting Across Platforms—Echo Global Logistics
Echo Global Logistics, an enterprise third party logistics company, wanted to create a solution to help trucking companies more effectively share data and status with Echo’s representatives and customers. The Echo team’s vision was to create a multi-platform service that allowed truck drivers to more easily report load status and to provide greater visibility to the carriers employing those drivers.
Following iterations allowed carriers and owner/operators to directly bid on loads when they become available to book, requiring less management, faster turnarounds, and increased revenue.

The challenge.
The logistics industry is highly fragmented, when it comes to the number and size of trucking companies that provide full truck load delivery. 70% of companies have 1-6 trucks, and less than 3% have more than 25.
Small trucking companies are traditionally highly paper-based and struggle to afford robust technologies that allow for capabilities like e-logging and automated load status reporting. But with trends in regulations pointing to digitization, like the use of e-logging instead of physical logs, the need for digital tools became a necessity.
Watch this video for a short overview of the challenge and our approach:
Key themes for this initiative.
Early-stage concept refinement (from feature idea overload to focused value)
Rapid alignment and reframing of goals, personas, and strategy
Strong use of UX strategy tools (field research, pain points and opportunities, journey mapping)
A pivot from tech-centered thinking to user-centered clarity
Our Discovery approach.
After a series of stakeholder sessions to understand essential elements of the logistics industry and the challenges to solve, we zeroed in on two particular gaps in knowledge: the drivers’ perspectives, and the office environment for carriers.
I led the product team in planning contextual inquiries and we headed into the field to find our user groups and gain the needed insights. Tracking down drivers in context was a challenge! They are on the move, and break times are precious. We performed enough short intercept interviews, however, to find the particular moments when drivers were grateful for something to do; when waiting at warehouses to load or unload - sometimes for hours.
Visiting carriers proved easier as the Echo client team was able to arrange these visits. This gave us direct views of the paper-based systems we were trying to help digitize.

Insights & opportunities.
Echo employs thousands of experts in the field of logistics, but the complexity of communication points between multiple user groups can still be overwhelming.
We created a visualization of the load journey that made these different touch points simpler and easier to discuss. I facilitated sessions for ideating around the pain points and needs of various groups, and we determined how each platform - the mobile app for drivers, desktop app for carriers, and integrations for Echo representatives - would contribute to a holistic solution.
Copies of the map were hung throughout our collaboration floor and aided in the socialization of our approach. The research and resulting visualization won an Honorary Mention at that year’s UX Awards, presented by UX industry leader Alan Cooper (see the video case study landing page for all winners that year).
One of our most important findings was around what might incentivize drivers to use the app. While initial plans had been to give drivers rewards for reporting on-time statuses, this did not have value for them because they often do not have direct control over on-time delivery. Instead, providing available loads and important reference information on-the-go were key needs we could address.
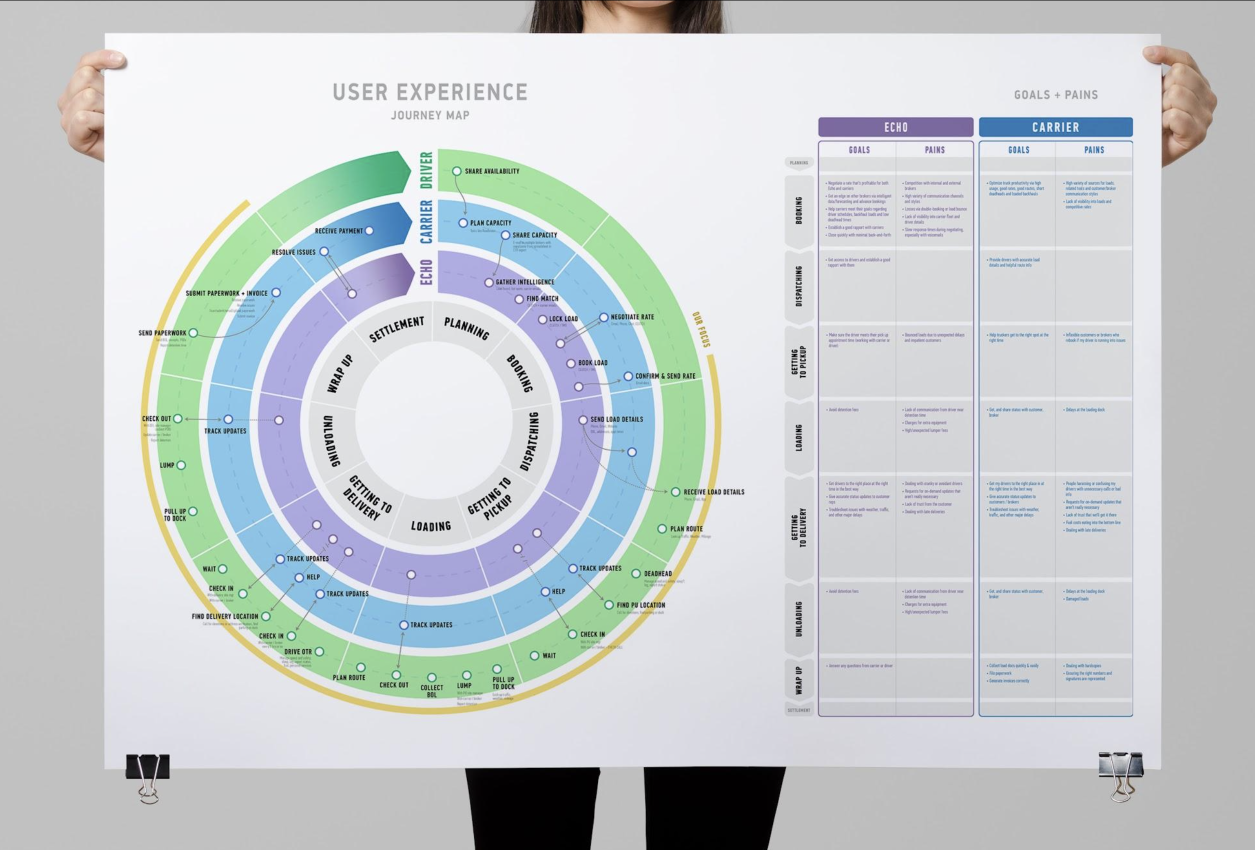
Visualization of the load journey, with cross-platform opportunities for multiple roles.
The system.
I created an extensive set of detailed wireframes and took point on UX writing, working in close collaboration with stakeholders. In the meantime, our visual design team worked with Echo to create the branding for a suite of products, including Echo Drive.


For Echo Drive itself, we designed and developed the mobile app for drivers, designed the desktop app for carriers, and worked closely with Echo’s development team to integrate important data into Echo’s systems. We worked closely with Echo client and carrier representatives to make sure our changes solved important problems for them, improving their work flows and communication needs.

The results.
The Echo Drive system continues to thrive as a part of Echo’s strategic digital offerings. At the time that the Eight Bit team completed our work, it had:
Met ELD mandate compliance with e-logging regulations
Reduced call-center stress with truckload visibility
Increased shipment revenues 16% to $184.4 million from Q4 of 2019 with 12% increased volume via the self serve booking application
Achieved driver engagement with 1000 beta downloads and 10,000+ active drivers on the app, with YoY growth from Alpha to Beta to product release